Power Bi Monitoring and Controlling with P6
Learn how to monitor project progress and control performance using Power BI dashboards and Primavera P6 data.
This course emphasizes practical application, teaching you how to build monitoring systems that help teams track, analyze, and manage project performance in real environments.
You’ll gain the skills to turn planning data into interactive visuals, actionable insights, and control-focused reports that support timely decisions.
- Best for: Planning Engineers, Project Controls Engineers, Project Managers, PMO Teams, Construction Managers
- Focus: Practical monitoring and controlling fundamentals, Power BI dashboards connected to Primavera P6 data, Performance tracking, trends, and KPIs, Visual analytics for schedule and progress reporting, Real-world project control workflows
- Certificate: Yes (downloadable completion certificate)
Instructor: Hany Ismail — Planning Engineer
Course Facts
Quick details:
| Recorded Videos 8 Hours | Practicing Time 22 Hours |
| Access Lifetime Access | Prerequisites (Recommended) Project Management Fundamentals |
Language: English
If you don’t have an account, it will be created automatically during checkout.

This course is designed for professionals who are involved in monitoring and controlling project progress, such as planning engineers, managers, project managers, and construction managers. Even if you have no prior experience with Power BI, this course provides all the necessary knowledge to transform a Primavera schedule into effective and interactive reports.
The course includes eight hours of recorded videos, along with practice files that can take up to 22 hours to complete. In just 30 hours of learning, you can acquire new and amazing skills that can add more power to your reports and enhance your monitoring and controlling capabilities.
This course will cover both the Power BI web app as well as the Power BI Desktop app. Topics covered include getting started with Power BI, connecting to data, visualizing data, publishing your visualizations in dashboards and reports, and connecting to other apps like Excel.
This course will teach you how Power BI works, how to connect data, and how to visualize and publish your data.
What makes this course unique?
At Planning Engineer Est., we believe that our Power Bi course is unique because of the way we approach teaching the software to our trainees. Instead of simply explaining the features and tools of Power Bi, we center our course on the visualization of reports in the minds of our trainees. Our goal is to enhance and polish their skills in applying the software to real-world scenarios.
To achieve this, we’ve designed a course that goes beyond theory and includes a real construction project. This project serves as a simulation of Power BI’s capabilities, providing our trainees with practical, hands-on experience using the software in the context of real-world project management.
We’ll guide our trainees through critical reporting techniques and all the required skills needed to seamlessly blend this powerful tool into their everyday project engineering and management tasks.
As an added value, we’ll also be sharing all the tips and tricks of Power Bi, as well as how to integrate Excel and Primavera features in BOQ, Cash, Layouts, and more.
At Planning Engineer Est., we always think of our members as one family, which is why we highly consider their comments and any additional requirements in our course outlines. By the end of this course, our trainees will have acquired new amazing skills that could add much more power to their reports and enhance their monitoring and controlling abilities in just 30 hours.
Our course is suitable for planning engineers, planning managers, project managers, construction managers, and anyone involved in monitoring and controlling project progress. Best of all, no previous experience in Microsoft Power Bi is required – this course includes all the knowledge needed to convert a Primavera schedule into effective, interactive reports.
Who should attend this course?

Anyone who is interested in using data to show real value and make decisions should take this course to carry out projects in an enhanced manner. The target audience for this course is:
- Planners, Schedulers
- Planning Engineers
- Program Managers
- End Users
- Construction Companies
- Project management Consultants
- Business Analysts
- Small to Large Enterprises
- IT companies, and any organization or individuals involved in any form of projects
Course WhatsApp Support Group
All enrolled trainees get an invitation to the course WhatsApp support group, where our team answers your questions about Power BI, Primavera P6 and your reports. The invitation link appears at the top of every lesson after you enroll.
Certificate of Completion

Completing this course and receiving the certificate of attendance can enhance your professional reputation and provide a competitive advantage in the job market. The certificate serves as tangible evidence of your newly acquired knowledge and skills, and can demonstrate to potential employers or clients your commitment to professional development.
In addition, having completed this course and earned the certificate can open up new opportunities for career advancement or career change. It can also serve as a foundation for pursuing more advanced courses or certifications in the field of project management.
Bonus Course: Progress Measurement System- Downloadable Course:
You Can’t Manage What You Don’t Measure. Why an accurate Progress Management System (PMS)? Does it really matter to spend time and effort to compile such a detailed system? There might be so many reasons for having an accurate progress measurement system depending on the type of project but the most important reason for us is to effectively Plan, Monitor, and Control The Project. And This is the Aim of Our Course.

Download Course Contents:
We Believe in Continuous Improvement – Making Planning Easy for You!
Driven by your questions and feedback, we’ve built an ever-growing Articles Library to support your learning journey. This library is regularly updated with fresh content to address your most common inquiries and requests.
If you don’t find the answer you’re looking for in the list below, don’t worry! Simply post your question in the course WhatsApp support group, and we’ll create a dedicated article to help you and others in the future.
Your feedback fuels our growth – let us know how we can support you better!

Invoices Management Power BI Dashboard [Article]
Date Created: July 3, 2025 | 573 downloads
Issue Management Power BI Dashboard
Date Created: July 3, 2025 | 673 downloads
Procurement Power BI Dashboard [Article]
Date Created: July 3, 2025 | 735 downloads
Engineering Power BI Dashboard [Article]
Date Created: July 3, 2025 | 717 downloads
A Tour of an Enterprise Power BI Dashboard [Article]
Date Created: July 3, 2025 | 522 downloads
Actual Units to Power Bi
Date Created: May 18, 2025 | 766 downloads

How to Auto-Refresh a Published Power BI Dashboard with Local Data
Date Created: May 11, 2025 | 651 downloads

How to Create Planned Value Vs Earned Value Report in Power BI
Date Created: April 9, 2025 | 1668 downloads
How to create an S-Curve in Power BI
Date Created: March 6, 2025 | 4446 downloads
How to Create a Simple Procurement Report in Power BI
Date Created: March 3, 2025 | 4912 downloads
- 1
- 2
Course Features
- Lectures 38
- Quiz 0
- Duration 30 Hours
- Skill level All levels
- Language English
- Students 1210
- Certificate Yes
- Assessments Yes
Curriculum
- 15 Sections
- 38 Lessons
- Lifetime
- Start Using Power Bi11 Items
- 2.1Download and Install Power Bi Free From Microsoft.4 Minutes
- 2.2Power Bi First Look.6 Minutes
- 2.3Create Your First Interactive Report In 12 Minutes Or Less.12 Minutes
- 2.4How To Share Your Reports With Others?7 Minutes
- 2.5Power Bi Home Tap19 Minutes
- 2.6Power Bi View Tap4 Minutes
- 2.7Power Bi Modeling Tap6 Minutes
- 2.8Power Bi Fields Area4 Minutes
- 2.9Power Bi Visualization Area16 Minutes
- 2.10New Power Bi Format Menu11 Minutes
- 2.11Save Reports To Pdf4 Minutes
- Get The Data From Primavera Schedule6 Items
- 3.1Convert WBS to Activity Codes Part 118 Minutes
- 3.2Activity Codes Tips and Tricks47 Minutes
- 3.3Convert Primavera Expenses to Resources12 Minutes
- 3.4How To Get The Baseline Dates From Primavera using our Excel Tool10 Minutes
- 3.5How To Get The Cost Per Week From Primavera using our Excel Tool18 Minutes
- 3.6How To Get The Update from Primavera (cost and resources) using our excel tool16 Minutes
- Weekly Progress Report6 Items
- 4.1Create Floor wise Weekly Planned Value VS Actual Value Chart21 Minutes
- 4.2Create Cumulative Planned VS Actual Weekly Value per Floor17 Minutes
- 4.3Clone the Weekly Values Report and Convert it to Weekly Hours Report12 Minutes
- 4.4Create Weekly Resources Assignment Report5 Minutes
- 4.5Activity Wise Detailed Weekly Report20 Minutes
- 4.6Review of Reports and Data- How to validate your data14 Minutes
- Shop Drawings and Materials Reports1 Item
- Look Ahead Schedule Reports1 Item
- Delayed/Ahead Activities Reports1 Item
- Cost Control (Actual V.S Budget Cost, Man hours)2 Items
- Overall Project Summary Dashboard1 Item
- Enterprise Report For More Than One Project1 Item
- Create An Interactive Online Resume By Power Bi1 Item
- Continuous Improvement and Course Support1 Item
- Course Completion Certificate1 Item
- Bonus Course: Progress Measurement System- Downloadable Course2 Items
- Share success and leave a review1 Item
- Support Articles Based on your Requests1 Item
Articles library
Practical articles and downloadable files for trainees on this course. New articles are added regularly.
Invoices Management Power BI Dashboard [Article]
Date Created: July 3, 2025 | 573 downloads
Issue Management Power BI Dashboard
Date Created: July 3, 2025 | 673 downloads
Procurement Power BI Dashboard [Article]
Date Created: July 3, 2025 | 735 downloads
Engineering Power BI Dashboard [Article]
Date Created: July 3, 2025 | 717 downloads
A Tour of an Enterprise Power BI Dashboard [Article]
Date Created: July 3, 2025 | 522 downloads
Actual Units to Power Bi
Date Created: May 18, 2025 | 766 downloads
How to Auto-Refresh a Published Power BI Dashboard with Local Data
Date Created: May 11, 2025 | 651 downloads
How to Create Planned Value Vs Earned Value Report in Power BI
Date Created: April 9, 2025 | 1668 downloads
How to create an S-Curve in Power BI
Date Created: March 6, 2025 | 4446 downloads
How to Create a Simple Procurement Report in Power BI
Date Created: March 3, 2025 | 4912 downloads
- 1
- 2
Questions & answers
Answers from our team to questions students ask in the course support group.
Start Using Power Bi
QCan I install Power BI on a Mac?
Power BI Desktop cannot be installed directly on a Mac. You can use the online (cloud) version in your browser, or run Windows in a virtual machine and use Power BI Desktop there.
QHow do I change the title of a visual?
Click the visual to select it, open the Format pane, search for Title, type the new title and press Enter.
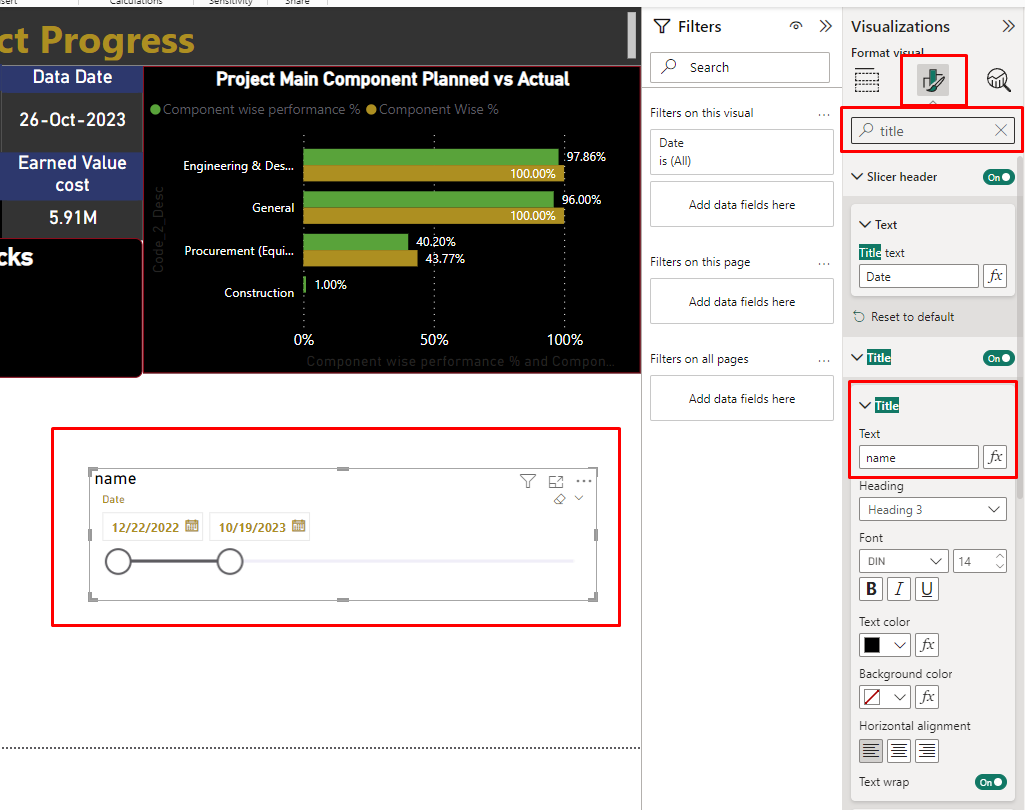
QThe date slicer does not show the "Between" sliding bar. How do I enable it?
In the slicer's Field box (Visualizations pane), click the arrow next to the date field and choose the field name itself instead of Date Hierarchy.
Then open Format visual > Slicer settings > Style and choose Between to get the sliding date bar.
Get The Data From Primavera Schedule
QWhy do we calculate the variance between weekly updates instead of using P6 values directly? How does the "Next Update" macro work?
P6 does not store the progress of each week. When you schedule to a new data date, P6 multiplies the activity % by the budget and redistributes the earned value / actual units over the whole span of the activity.
Example: budget = 100. In January the activity is 20% complete, so January = 20. If the % stays the same and you schedule again in March, P6 spreads the 20 over January and February (10 + 10) – which is wrong, because all 20 happened in January.
That is why we store each update in Excel and take the difference from the previous one. If an activity is 25% after week 1 (25) and 75% after week 2 (75 cumulative), the Next Update macro subtracts them to give week 2 = 50.
For every update after the first: copy the actual units from P6, delete the extra date columns, and run the Next Update macro. (Financial Periods in P6 are an alternative way to store period values.)
QIn P6 the actual cost is not equal to the earned value for some activities. Which one should I use?
Earned value in P6 = progress % × budgeted (baseline) cost, while the actual cost can be calculated automatically or entered manually, so they can differ. We prefer to work with actual units that match the earned value, then send their distribution to Power BI.
More: Actual cost not calculated automatically – Primavera P6 (Solved).
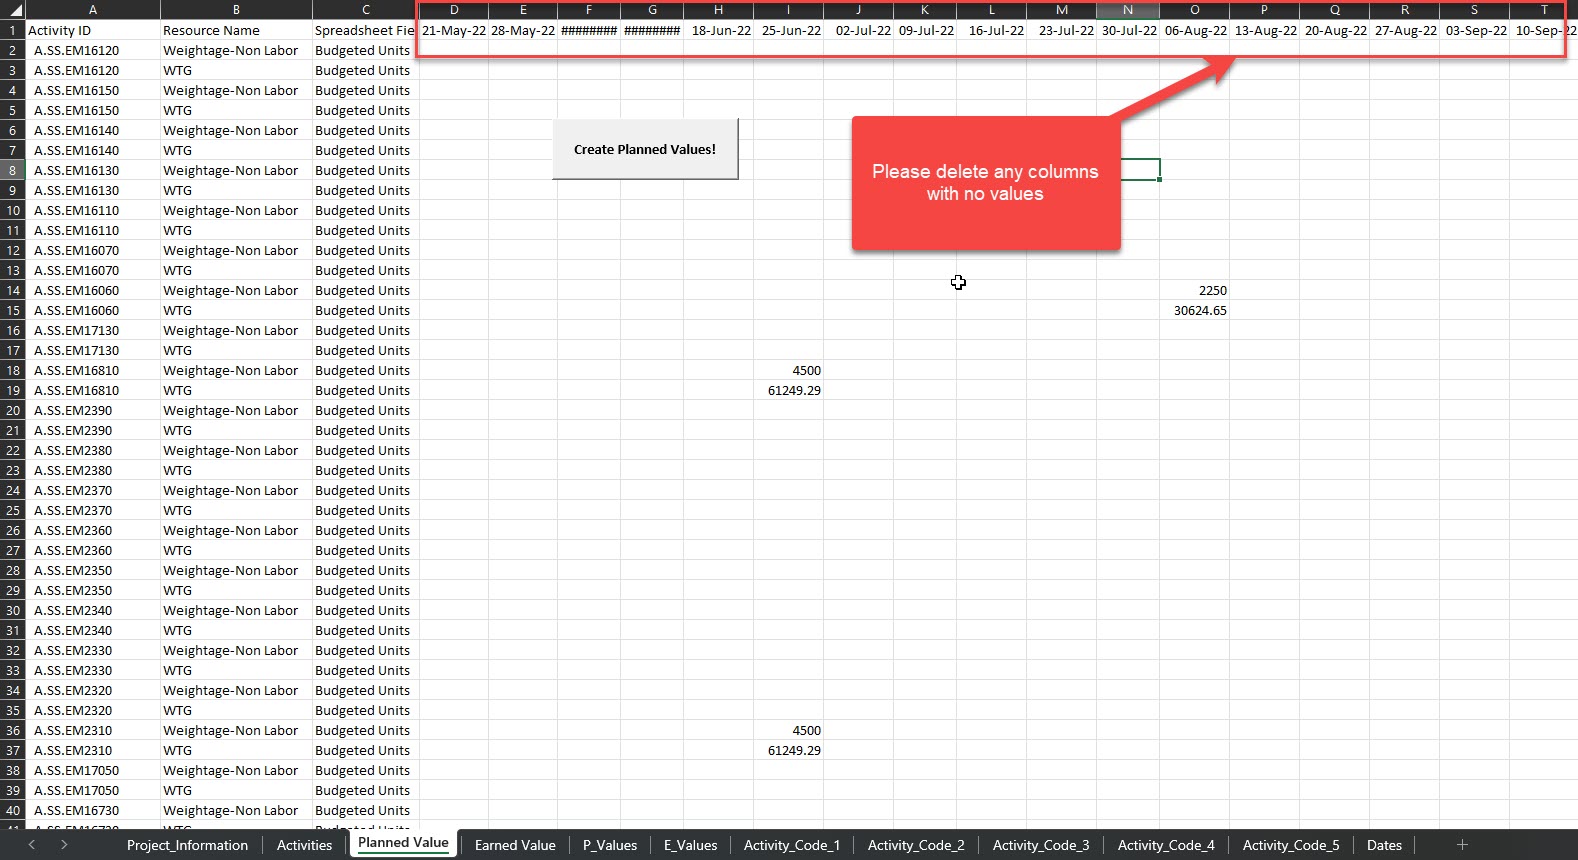
QThe planned value macro stops with a run-time error (1004 or 6). What should I do?
- Delete any columns that have no values before running the macro (see the screenshot).
- If it still stops, run the macro on the first ~2000 rows to check whether the problem is the macro or the data.
- As an alternative, unpivot the planned value date columns manually with Power Query (in Excel or in Power BI) – the result is the same.
Weekly Progress Report
QWhere does Power BI store previous weeks' data, and how do I build a previous week vs current week table?
Power BI does not store data – it is a visualization tool that reads from a data source (Excel, CSV, SQL, etc.). Store each weekly update in your Excel database with a week number (week ID).
For example, copy each week's activity % from P6 into Excel with its week ID, calculate earned value (% × cost), and use the activity ID + week ID to get each week's value and the difference from the previous week. In Power BI, when you filter on a week, show the data of that week and of week − 1.
QHow do I update my Power BI report every week? Do I rebuild it?
No. Update the data source, not the report. Copy the new data from P6 (e.g. earned value and forecast dates), paste it into your Excel database, then click Refresh in Power BI. Which data you copy depends on what your dashboard shows, and the copy can be automated so the weekly update takes seconds.
QEarned value appears in months after the data date in my dashboard. How do I fix it?
Check the model relationships. In the reported case the date relationship was inactive (shown as a dotted line) because of extra relationships on Activity ID between the activities, P_values and E_values tables.
Remove those extra Activity ID relationships, then double-click the dotted date relationship and choose Make this relationship active. The values then fall in the correct months.


QI added columns to my Excel database but the new dates do not show correctly in Power BI. Why?
- Make sure the new columns are inside the Excel data table (tip: name tables like their sheets).
- Make sure the table is imported in Power BI (Data pane).
- Refresh after any change in Excel.
- Check that your queries have no errors and the new columns have the right data type.
If you search or filter by activity name, use a unique value: many activities can share a word (e.g. "Protection"), so Power BI returns the earliest/latest/count of all of them. Search by Activity ID to get the dates of a single activity.
Delayed/Ahead Activities Reports
QHow do I build a delay chart for each data date, and is the delay counted in working or calendar days?
Copy the activities from P6 with the Start and Finish (forecast) columns visible and use them in Power BI. To see the current delay you only need the latest update; to keep the history of every update, you need to import each update.
Delay = updated finish − baseline finish, in calendar days – this is the common understanding for all stakeholders. At WBS level, watch the total float of each WBS rather than the maximum activity delay.
Cost Control (Actual V.S Budget Cost, Man hours)
QHow do I multiply two fields (e.g. actual cost × actual cost %) in Power BI?
Create a quick measure:
- From Table Tools choose Quick Measure (or click the three dots on a field > New quick measure).
- Choose Multiplication as the calculation.
- Drag the two fields into the boxes and click Add.
- Use the new measure in your visuals, e.g. to calculate the variance against the planned cost.


Enterprise Report For More Than One Project
QCan I add several projects to the same database?
Yes – that is one of the main reasons to use Power BI. Update each project with our Excel macro, paste the results into the database, then add the next project, one project at a time. The data will not overlap if you add one project at a time.
No questions match your search.