

Excel Power Query in Planning
You might have heard before about the Microsoft Excel Power Query. However, have you ever used it in your daily planning tasks? In this article, I want to give you some more information about the application of power queries in construction planning. Don’t worry, it is very simple and very easy.
A. What is a power query?
I will not talk from a technical point of view. I will talk from a practical and simple point of view. This power query is your assistant. If you have a secretary who will listen to your requests and do it perfectly whenever you ask.
B. Advantages of Power Query
1. It can do many tasks very Fast
Ready to take your skills to the next level? 🚀 Check out our Special Online Courses! 🚀
Gain valuable insights, boost your career, and learn from industry experts.
2. It will do the tasks in the order you told it
3. Order comes First, Served First
4. It saves you orders in case you need to repeat it later on
5. It can do several tasks in one order
C. Power query in planning
Following I will give you some examples of Excel query applications in the construction planning field. When you get used to it, I am sure you will use it in your daily tasks.
1- Replace values in your sheets:
We all copy data from Primavera P6 to use in reports in Excel. One common issue is when you copy the data, some blank spaces before the activity ID are there. Using Excel power query, you can set up an automatic process to remove blank spaces from a column automatically.
Right Click on BOQ Ref and Choose Replace Values

2- Convert P6 data distribution to pivot table
If you are trying to create an Excel pivot table to show the weekly, and monthly progress for example, you can copy the data from resource assignment; however, the data will be stored in every week/month column.
Using power query you can unpivot the columns to store the date and value in 2 columns only where you can perfectly use them in your pivot tables.
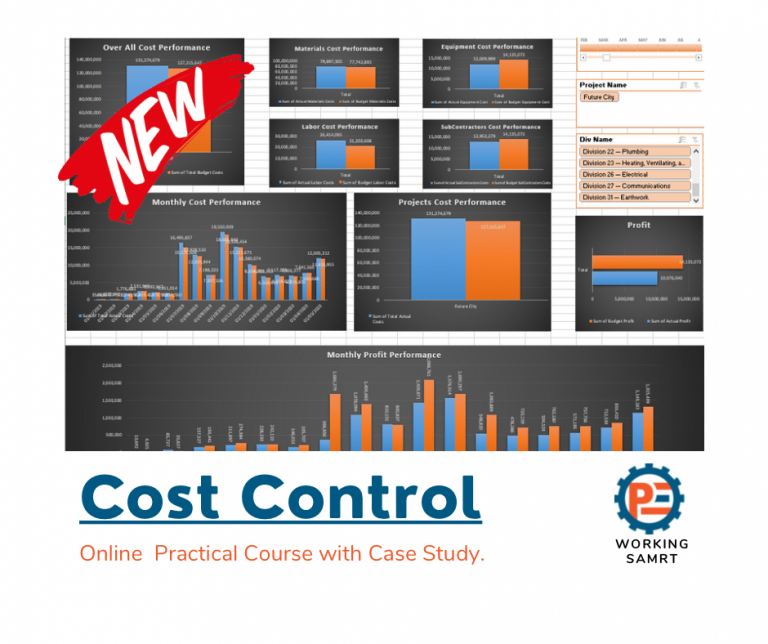
Cost Control for Construction Projects
Course WhatsApp Support Group All enrolled trainees get an invitation to the course WhatsApp support group, where our team answers your questions…
- 805 students
- WhatsApp support group
- Certificate
Choose the needed Columns and Right click on them choose Unpivot Columns

3- Combine 2 tables:
Using Power Query, we can combine two tables. This is very useful when you are doing cost loading. If you define each activity with its relevant BOQ item, then you can combine these two tables to create a new table with the activity budget cost.
We just need to tell what is the link between the two tables so it can create a proper Merge. In our case, BOQ Ref is the link between the Two Tables

4- Create Custom Calculated Columns
This is a very useful feature. Let’s say you copy some data from Primavera, and you use this data in an Excel report. However, you need to do some calculations before being able to create your report. For example, you need to multiply the % completed by certain resources in your schedule. You can do it easily using power query custom calculated columns.

5- Conditional Columns
You can create a column that gets its data from another column based on column value. Something similar to VLockup. But here, it is much faster for large data and automated. It means whenever your data is changed, the same conditions will apply. No need to drag formulas. I am using this feature in the cost control process to define the materials costs, labor costs, equipment costs…etc.

6- Using different columns from different tables
By creating relationships between your tables, you can create a pivot table using different columns from different tables.
I am using the Date for example to Order Date that should be done. Then I can compare it with the actual date of the material duration to define the Procurement.
Now we will start creating relationships between tables. Click on a Column from a sheet to another column in the other sheet

D. Following are some applications we used on the Intermediate Planning Course:
- Calculate the quantity and value of each BOQ item per floor based on floor weight.
- Creating activities ID based on Master Activity ID.
- Create a Relationships sheet for all floors based on Mater Activity relationships.
- Create Relationships between Shop drawing approvals and relevant construction activities.
- Create Relationships between materials delivery and relevant construction activities based on Master ID.
- Assign Crew hours to activities and calculate the detailed working hours per activity and trade.
To be honest, the Excel power query helped me a lot in my daily tasks as a planning manager. It is amazing when you develop a data model to perform several steps with your data and store it in one query which you can refresh in a few seconds to update all your data accordingly. Having such a feature encouraged me to create a powerful course for cost control in construction projects using this technique. It is powerful, simple, and easy. You are welcome to check the course from the below link.
E. Want to learn more?
Check the below links for the cost control course and Intermediate Planning Course where you will learn Excel Power Query and implement it in the Baseline creation & cost control data model. This is a smart way to manage your project with minimal effort.
Download the Resources of this Article
Excel Power Query in Planning 444.56 KB 2605 downloads

Keep in Touch
Join our Email Newsletters and receive FREE weekly useful content!

Keep growing with Planning Engineer
Learn with a clear path
From Primavera P6 basics to claims, cost control and Power BI. Start with our free courses.
Browse coursesGet help on WhatsApp
Every course comes with a private WhatsApp support group where our team answers your questions.
Join a courseFind planning jobs
25 open planning and project control jobs. Post your resume so employers can find you.
See jobsGet tips by email
Free planning tips, templates and course offers. Unsubscribe any time.
Related posts:






You may also like

How to Minimize Total Float in Construction Activities

